Pea versus soy protein isolate in dairy formulation stability
Soy protein isolate typically contains more than 90% protein. Pea protein isolate (PPI) generally contains 80% to 85%.
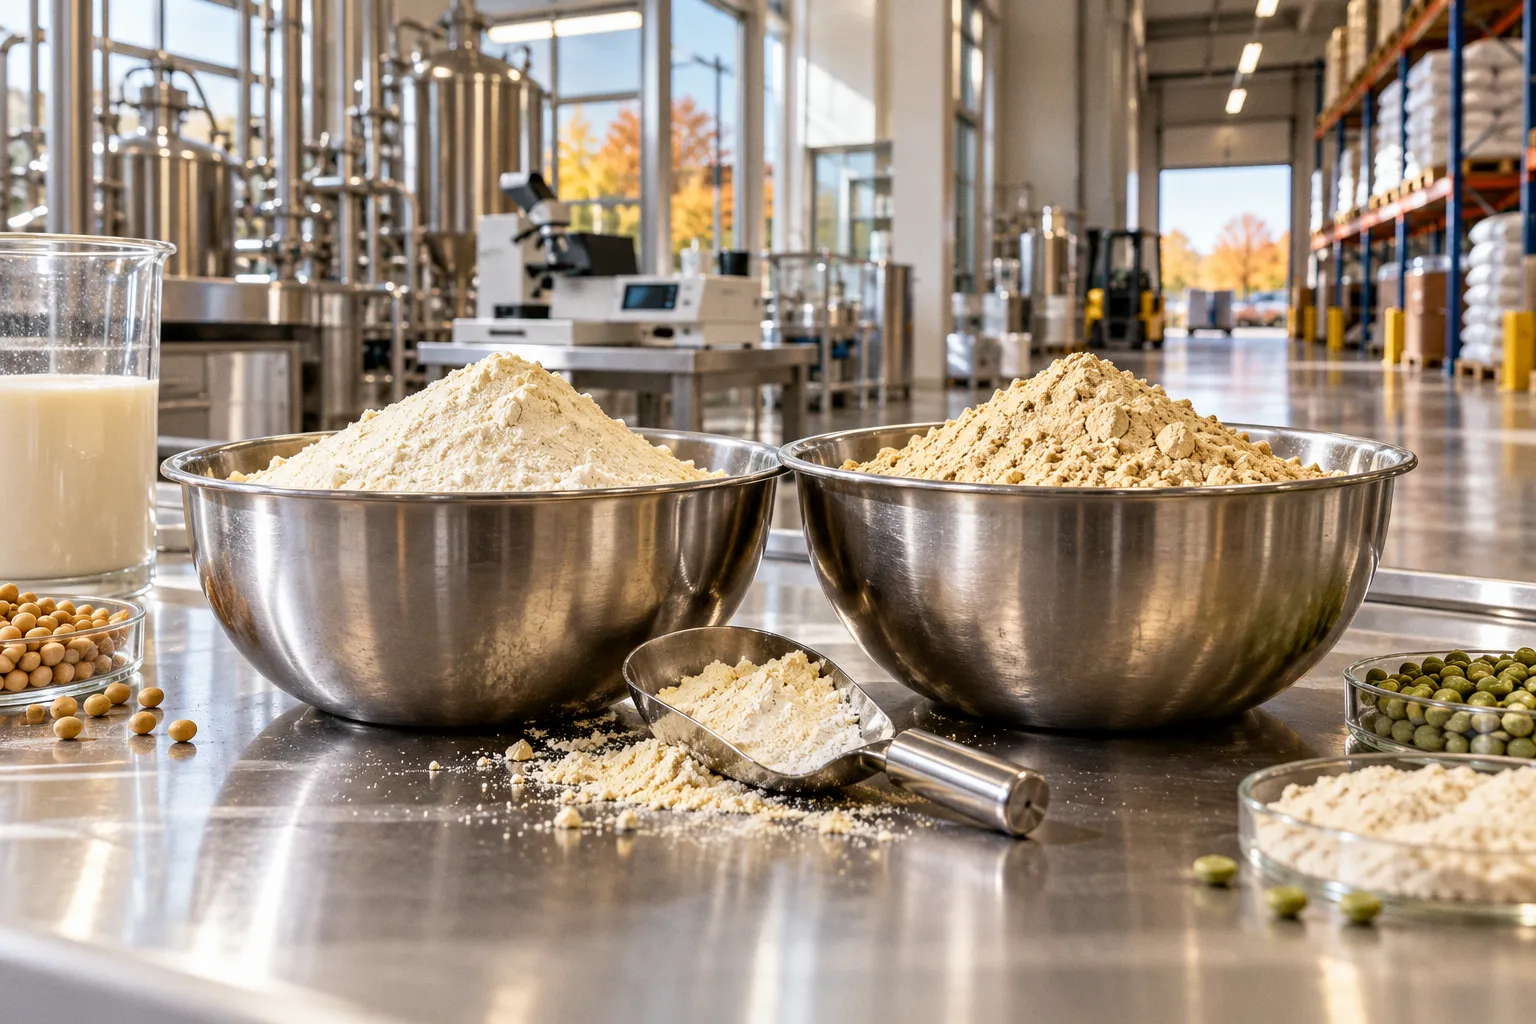
Protein purity and compositional impact on formulation
That difference affects the amount of ingredient required to reach a target protein level, and the non-protein fraction entering the formula with it.
For a beverage targeting a fixed protein concentration, PPI may require a higher inclusion rate than soy protein isolate (SPI). That changes the solids load and can affect viscosity, dispersion, and the demand placed on the homogenization step. Protein purity alone does not predict finished-product stability, but it is a material input to the formulation balance.
The comparison of pea protein isolate vs soy protein isolate in dairy alternatives therefore depends on product architecture. A neutral-pH drink with a substantial oil phase presents different constraints from an acidified beverage. In each case, protein solubility, adsorption at the oil-water interface, thermal history, and pH interact.
PPI also offers a non-allergenic advantage relative to soy for manufacturers seeking to avoid soy ingredients. That formulation choice does not establish equivalent functionality across all conditions. SPI has stronger gelling capabilities, and the available comparative data do not support treating pea isolate as superior in heat-induced gel strength.
Emulsion dynamics: droplet size and oil encapsulation
In high-shear homogenized model food emulsions, SPI produced an average droplet diameter of 60.0 μm. PPI produced approximately 57.9 μm. These measurements are close. They indicate that both proteins can support droplet formation under the tested conditions, while they do not establish equivalent performance across equipment, oil loads, pH values, or storage periods.
Droplet diameter is one part of emulsion characterization. Interfacial protein adsorption and fat encapsulation efficiency also matter. A small measured droplet size does not, by itself, demonstrate resistance to coalescence or creaming over a product’s intended shelf life.
Moderate pre-heating changed encapsulation outcomes in the reported comparison. At 85 °C before homogenization, oil encapsulation efficiency reached 94.38% with SPI and 82.06% with pea protein. The gap is formulation-relevant. It shows that the same thermal step did not produce the same measured interfacial outcome for the two protein sources.
Similar droplet diameters do not establish similar encapsulation efficiency. The thermal sequence changes the comparison.
For development work, the order of operations belongs in the specification. Protein hydration, heat treatment, oil addition, and homogenization should be held constant when comparing isolates. Otherwise, a difference attributed to ingredient identity may reflect process variation.
Thermal processing at 85 °C
The 85 °C pre-treatment result is a process-specific observation, not a universal performance guarantee. It gives a useful reference point for screening, especially where a beverage process includes a comparable heating stage. It does not establish the behavior of either isolate under every pasteurization, UHT, or post-homogenization regime.
Thermal exposure can alter protein structure and the availability of surface-active regions. Those changes affect interfacial adsorption and the formation of a protein layer around oil droplets. The resulting stability depends on the complete process sequence, including the time-temperature profile and the pH at which the protein is dispersed and heated.
SPI’s higher measured encapsulation efficiency after the stated pre-treatment supports its selection when oil retention under comparable conditions is a primary target. PPI’s result remains functional, but the difference should be addressed through process or formula development rather than assumed away.
Commercial shelf-life conclusions require separate evidence. The available facts do not establish a 12-month ambient stability comparison for UHT plant milks formulated with either isolate and without hydrocolloid stabilizers. A model emulsion result cannot substitute for that validation.
pH-dependent solubility and formulation constraints
PPI solubility varies substantially with pH. At pH 4 to 5, reported solubility is 30% to 40%. At pH 6 to 8, it rises to 40% to 70%. This range has direct implications for dispersion and physical stability in beverages.
Acidified formulations are therefore a distinct development case. Lower solubility can increase the risk of incomplete hydration or protein aggregation, depending on the ingredient grade and process conditions. A protein that disperses adequately in a neutral drink may not maintain the same behavior after acidification. That is central to protein stability in acidic beverage formulations.
The figures supplied for PPI do not provide a matching pH-resolved solubility series for SPI. A numerical solubility comparison of pea and soy isolates cannot be made from these data alone. Selection should rely on supplier specifications and bench testing at the product’s actual pH, rather than extrapolation from protein purity or from an emulsion result at another pH.
Formulators should also separate solubility from viscosity. A higher soluble fraction may change continuous-phase behavior, but the available comparative figures do not quantify viscosity for either isolate. Viscosity impact depends on protein concentration, hydration, pH, thermal treatment, and the presence of other solids or stabilizers. It should be measured in the intended formula.
Flavor profile differences are similarly grade- and process-dependent. The supplied evidence does not quantify flavor neutrality or compare sensory performance. For a dairy alternative, flavor screening remains a product-specific requirement; it cannot be inferred from the protein source’s purity or emulsion droplet diameter.
Protein concentration and stable oil-in-water systems
For oil-in-water emulsions containing 30% to 50% oil by volume, approximately 5% w/v PPI was required to establish stable systems across pH values from 3 to neutral. This is a useful lower-bound reference for that stated composition range. It is not a universal inclusion rate for all beverages.
The concentration requirement matters commercially and technically. At 5% w/v, the protein load contributes materially to total solids. Any adjustment to reach a target protein declaration can alter hydration demand and flow behavior. In an acidified system, the lower PPI solubility range adds another constraint. The combined effect must be assessed in the finished formula.
| Formulation parameter | Pea protein isolate | Soy protein isolate |
|---|---|---|
| Typical protein content | 80%–85% | More than 90% |
| Average droplet diameter in the reported high-shear model emulsion | Approximately 57.9 μm | 60.0 μm |
| Oil encapsulation efficiency after 85 °C pre-treatment | 82.06% | 94.38% |
| Reported solubility at pH 4–5 | 30%–40% | No matched figure available |
| Reported solubility at pH 6–8 | 40%–70% | No matched figure available |
| Minimum concentration reported for stable 30%–50% v/v oil emulsions | Approximately 5% w/v across pH 3 to neutral | No matched minimum available |
The table separates measured values from missing comparisons. It should not be read as a full ranking. In particular, the absence of a matched SPI solubility or concentration threshold prevents a direct numerical conclusion on those parameters.
A useful development screen controls the variables most likely to confound the comparison:
1. Set the same target protein level and record the resulting ingredient inclusion rate. The different protein purities mean equal ingredient weights do not provide equal protein input.
2. Fix hydration time, mixing conditions, and pH before adding oil. This limits dispersion differences from being misread as interfacial performance.
3. Compare the same oil fraction and homogenization conditions. The reported droplet diameters apply to a specific high-shear model system.
4. Include the 85 °C pre-treatment only when it represents the intended manufacturing sequence. Record the heating stage relative to homogenization.
5. Measure stability and viscosity in the finished matrix. Ingredient-level figures do not establish shelf life, sensory quality, or flow behavior in a commercial beverage.
Choosing the isolate for the product architecture
SPI has the higher protein purity and the stronger reported gelling capability. Under the cited 85 °C pre-treatment, it also achieved higher oil encapsulation efficiency than pea protein. Those properties make it a stronger candidate when protein density, gel formation, or encapsulation performance dominates the specification.
PPI produced a slightly smaller average droplet diameter in the reported model emulsion and offers a non-allergenic alternative to soy. Its lower protein purity and pH-dependent solubility affect the formulation balance, particularly in acidified products and high-oil systems. The data support its use as a functional ingredient, but not an assumption of parity across all process conditions.
The practical decision is conditional. For neutral-pH emulsions, both isolates merit screening under matched processing. For acidic beverages, PPI’s reported solubility range makes pH and dispersion behavior explicit development variables. For systems requiring heat-induced gel strength or higher encapsulation efficiency after 85 °C pre-treatment, the available comparison favors SPI.
Formulation viability depends on matching the isolate to pH, oil fraction, thermal sequence, and target protein level. Pea protein isolate is viable where its solubility and concentration requirements fit the matrix. Soy protein isolate is viable where its allergen status is acceptable and its higher purity, gelling function, or measured encapsulation result aligns with the specification.